Note
Go to the end to download the full example code.
NDVI
Operation using two raster bands
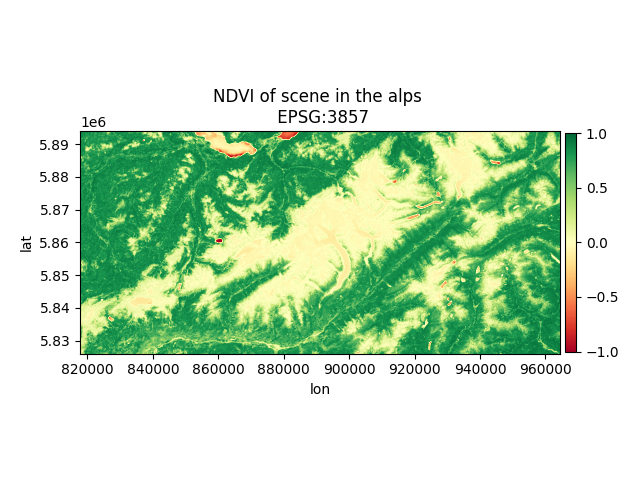
In this example we read two Sentinel 2 raster bands and combine them to calculate the Normalized Difference Vegetation Index (NDVI). Since these bands are already from the same Sentinel 2 acquisition, they are already ‘aligned’. This means none of the bands have to be resampled before we combine them.
Tip
If this example matches your use case, you may also be interested in the packages Rasterio or Rioxarray. This example is created to get the reader familiar with the synax of GridKit and to highlight some of the intricacies when working with this package.
import matplotlib.pyplot as plt
import numpy

from gridkit.io import raster_to_data_tile

# Read in the bands required to determine the NDVI
band_4 = raster_to_data_tile("../../tests/data/20220708_S2_L2A_B04_raw.tiff").astype(
    float
)
band_8 = raster_to_data_tile("../../tests/data/20220708_S2_L2A_B08_raw.tiff").astype(
    float
)
Warning
The source data is defined in int16, which is consequently also the numpy dtype after reading.
The numbers that result from adding the two bands are too large to store in a dtype of int16.
Numpy does not upcast automatically, so we need to be aware of the dtypes ourselves.
In this case the dtype is increased to int32, by calling astype directly after reading.
If this is not done, the script will run, but the resulting values will be incorrect.
# Determine the NDVI
ndvi = (band_8 - band_4) / (band_8 + band_4)
ndvi[~numpy.isfinite(ndvi)] = 0  # fill NaN values resulting from a division by 0
Note
If, for any cell, the denominator (band_8 + band_4) is zero, Numpy raises a warning.
The return value for these cells is a numpy.nan.
They will show as white in the image.
For a smoother looking visualization, these values are replaced with a zero in this example.
This decision is of course use case dependent.
# Plot the result
fig, ax = plt.subplots(1)
im_ndvi = ax.imshow(ndvi, cmap="RdYlGn", extent=band_4.mpl_extent, vmin=-1, vmax=1)
fig.colorbar(im_ndvi, ax=ax, fraction=0.022, pad=0.01)
ax.set_xlabel("lon")
ax.set_ylabel("lat")
ax.set_title(f"NDVI of scene in the alps \n EPSG:{ndvi.grid.crs.to_epsg()}")

plt.show()

Total running time of the script: (0 minutes 0.716 seconds)