Note
Go to the end to download the full example code.
Geometry intersections
Obtain the cells that intersect with vector geometries.
DEM data source: https://www.eea.europa.eu/data-and-maps/data/copernicus-land-monitoring-service-eu-dem
Introduction
Vector geometries can be used to obtain the ID of the intersecting grid cells. These vector geometries can be either in the form of Shapely (Multi) Geometries or GeoPandas GeoSeries. A list of geometries can be supplied. This list can contain a mix of geometry types.
Tip
While it is technically possible to stack Multi-Geometries (for example a MultiPolygon of MultiPolygons), this is not good for performance of intersect_geometries.
Try to avoid this if possible.
In this example, GeoPandas is used instead of Shapely, for it also allows us to conveniently read in the vector data.
Note
GeoPandas is not installed with GridKit by default, while Shapely is.
Reading and preparing the data
After reading the streams and lakes vector files, they are concatenated into a single GeoDataFrame. This allows us to obtain the intersecting cells in one function call. Of course it is also an option to obtain the intersecting cell IDs for the strams and lakes separately and combine them after using numpy.vstack. With that approach it might be worthwhile to call a numpy.unique on axis 0 afterwards to remove duplicate IDs.
import geopandas
import matplotlib.pyplot as plt
import pandas

from gridkit import read_raster

rivers = geopandas.read_file("../../tests/data/streams.gpkg")
lakes = geopandas.read_file("../../tests/data/lakes.gpkg")
dem = read_raster("../../tests/data/alps_dem.tiff")

water_bodies = pandas.concat([rivers, lakes]).reset_index().to_crs(dem.crs)

river_cell_ids = dem.intersect_geometries(water_bodies.geometry)
Visualization
For a clear plot, we only need to plot the DEM near the vecor geometries as a backround.
For that reason, the dem is cropped to the extent of the water bodies with a little buffer.
Since intersect_geometries does it’s own cropping, cropping the grid before intersect_geometries does not increase performance.
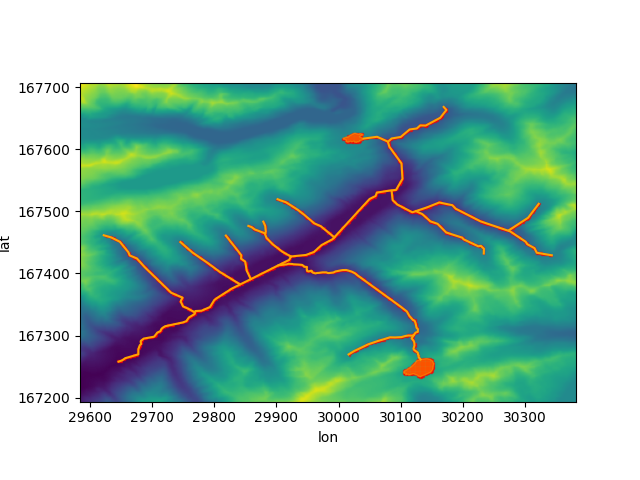
A plot showing DEM, the geometries (orange) and the selected cells (red) is then generated as follows:
dem = dem.crop(water_bodies.total_bounds, bounds_crs=water_bodies.crs, buffer_cells=20)


def generate_plot():
    fig, ax = plt.subplots()
    ax.imshow(dem, extent=dem.mpl_extent)

    for poly in dem.to_shapely(river_cell_ids).geoms:
        x, y = poly.exterior.xy
        ax.fill(x, y, alpha=0.5, color="red")

    for geom in water_bodies.geometry:
        try:
            x, y = geom.exterior.xy
            ax.fill(x, y, alpha=0.5, color="orange")
        except AttributeError:
            x, y = geom.xy
            ax.plot(x, y, c="orange")

    ax.set_xlabel("lon")
    ax.set_ylabel("lat")
    return ax


generate_plot()
plt.show()

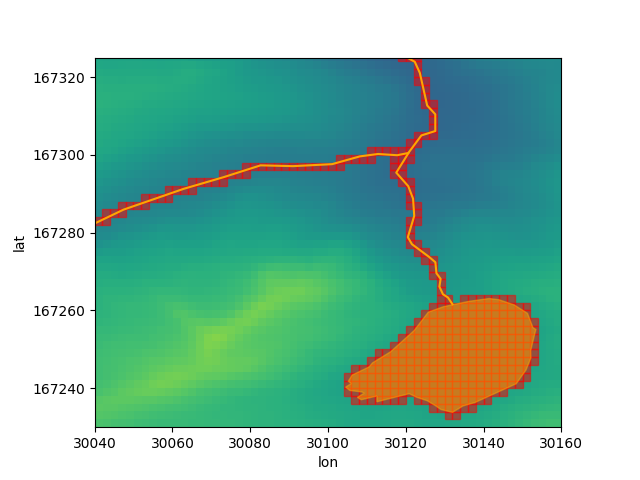
A zoom-in of a section of the plot allows us to see more clearly what cells are selected.
ax = generate_plot()
ax.set_xlim(30040, 30160)
ax.set_ylim(167230, 167325)
plt.show()

Total running time of the script: (0 minutes 4.257 seconds)