Note
Go to the end to download the full example code.
Triangles in hexagons
Aligning different types of grids
Introduction
In this example a triangle and a hexagon grid are defined in such a way that they perfectly line up. A hexagon can be neatly divided into six triangles.
Tip
The process in this example has been greatly simplified with the introduction
of HexGrid.subdivide() in v0.12.0.
This example shows the more cumbersome approach, but I will leave this example
up for now for educational purposes, for it shows how to manipulate cell size
and offsets to position the grid the way you want.
- For the two grids to visually align, two things will need to match:
the length of the edge connecting two vertices needs to be the same
they need an origin point that lines them up properly
When initializing a grid in GridKit, the size specified by the user reflects the distance between the centroids of two neighboring cells (dx). For the hexagonal grid this will be a different value than for the triangle grid. The triangle grid is easiest. The side length is 2*dx. Let’s say we want side lengths of 1, we specify a size for the triangle grid of 0.5. For the hexagonal grid this is less intuitive, it works out to be three over the square root of three: 3 / sqrt(3). At least this is the case if we use a ‘flat’ orientation for our hexagonal grid, which we will need to do in order for the grids to overlap. If this is not obvious, I encourage you to do this exercise with a ‘pointy’ hexagonal grid. It will be obvious from the plot.
Let’s first plot some cells of these two grids and compare them. From there we can figure out how to shift the grids in order to align them.
import matplotlib.pyplot as plt

from gridkit import HexGrid, Tile, TriGrid
from gridkit.doc_utils import plot_polygons

tri_grid = TriGrid(size=1)
hex_grid = HexGrid(size=3 / 3**0.5, shape="flat")

tri_tile = Tile(tri_grid, (-14, -7), 27, 13)
hex_tile = Tile(hex_grid, (-5, -4), 9, 7)

# Note: The grid is copied when creating a tile such that the grid that is related to the tile
# does not unexpectedly change when the original grid object changes.
# In this example we do actually want to change the grid that is related to the tile
# so let's redefine the grids to point to the copies that are related to the respective tiles.
tri_grid = tri_tile.grid
hex_grid = hex_tile.grid

ax = plt.subplot()
tri_geoms = tri_tile.to_shapely()
plot_polygons(tri_geoms, fill=False, colors="pink", linewidth=2, ax=ax)
hex_geoms = hex_tile.to_shapely()
plot_polygons(hex_geoms, fill=False, colors="cyan", linewidth=2, linestyle=":", ax=ax)
# Create lattice with spacing of dx and dy to highlight cell bounds
ax.set_xticks([i * hex_grid.dx for i in range(-5, 5)])
ax.set_yticks([i * hex_grid.dy for i in range(-5, 5)])
ax.grid()
plt.scatter(0, 0, s=10, zorder=10)
plt.show()
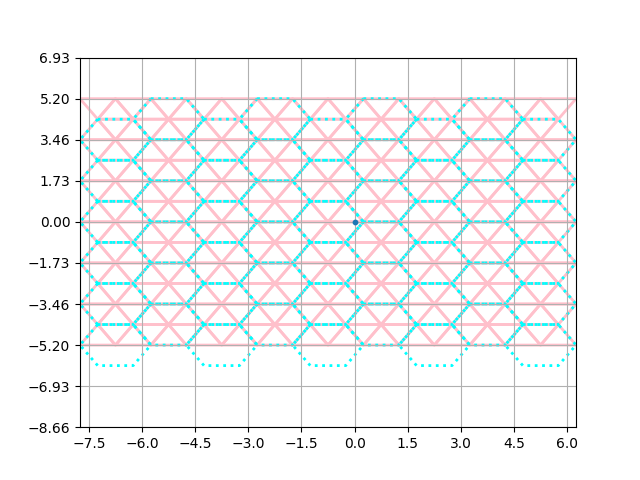
The grids seem to be similar in terms of side length. Let’s verify this:
print(tri_grid.side_length, hex_grid.side_length)
import numpy

assert numpy.isclose(tri_grid.side_length, hex_grid.side_length)
1 1.0000000000000002
The grids are not aligned however. We can use the BaseGrid.anchor() method on both grids
to force them to have a corner at the same location, but let’s supply a manual offset
for educational purposes. Say we want to position the hexagon around zero.
From visually inspecting the plot I can tell we’d have to
shift the hexagon to the right by half a dx.
The triangles already cross at the origin so that will do for our usecase.
Note
Before version 1.0.0 , when dealing with a ‘flat’ hex grid, the x and y of offset need to be set in reverse order: (y,x). This is a conceptual inconsistency that has since been fixed.
Tip
For simpler centering of grids around origin, see BaseGrid.anchor()
hex_grid.offset = (hex_grid.dx / 2, 0)

ax = plt.subplot()
tri_geoms = tri_tile.to_shapely()
plot_polygons(tri_geoms, fill=False, colors="pink", linewidth=2)
hex_geoms = hex_tile.to_shapely()
plot_polygons(hex_geoms, fill=False, colors="cyan", linewidth=2, linestyle=":")
# Create lattice with spacing of dx and dy to highlight cell bounds
ax.set_xticks([i * hex_grid.dx + hex_grid.dx / 2 for i in range(-5, 5)])
ax.set_yticks([i * hex_grid.dy for i in range(-5, 5)])
ax.grid()
plt.scatter(0, 0, s=10, zorder=10)
plt.show()
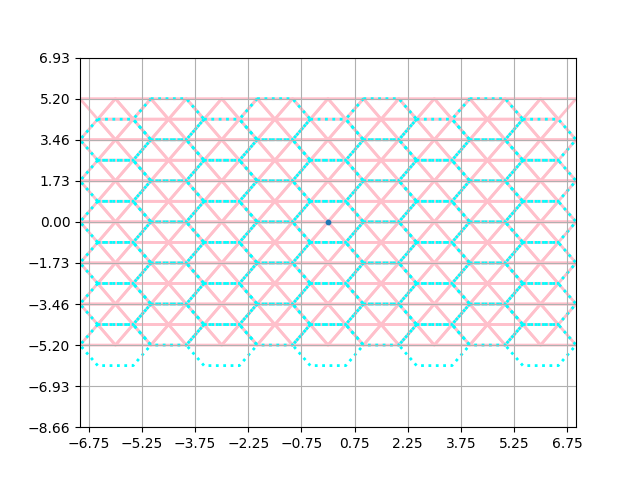
Et voila. Our grids are centered around the origin.
Now we can play with the interaction between these grids.
We can for example figure out what triangles belong to what hexagon.
The simplest way to do this is to get the centroids of the triangles
and call cell_at_point on the hexagon grid using these centroids.
We can even give every triangle in the top-left of a hexagon the same color for example.
Because of the way we ordered the cell-ids, we know that
the first triangle will be in the top left of the hexagon.
If you obtained the cell id’s in a different manner,
you can sort them to make sure this is the case.
You can use numpy for this, like numpy.sort(tri_ids.ravel()) for example.
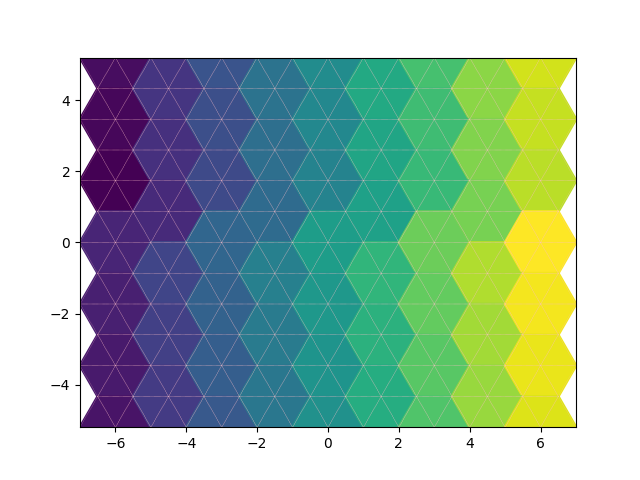
First let’s find all the hex_ids. We can then assign each hex id a different value. Then we plot the triangles using these values and expect the hexagon grid to be reflected in the colors
tri_centroids = tri_grid.centroid(tri_tile.indices)
hex_ids = hex_grid.cell_at_point(tri_centroids).ravel()
value_map = {tuple(cell): i for (i, cell) in enumerate(hex_ids.unique().index)}
color_values = [value_map[tuple(cell)] for cell in hex_ids.index]
plot_polygons(tri_geoms, fill=True, cmap="viridis", colors=color_values, linewidth=2)
plot_polygons(tri_geoms, fill=False, colors="pink", linewidth=0.3, linestyle=":")
plt.show()
As mentioned above, we can use the order of the data to color the cells based on whether they are the first, second, third etc. occurrence for the given hexagon. For good measure let’s also make the color dependent on the y-value of the hexagon, for good measure. We can create a dictionary based on the tuple representation of the index to keep track of the number of triangles in the grid. Then we create a colors list that will have a number for each triangle based on whether it was the first, second, etc. triangle in that hexagon.
id_counter = dict()
color_values = []
for id in hex_ids.ravel().index:
    id = tuple(id)
    if id in id_counter:  # increment value for hexagon if present
        id_counter[id] += 1
    else:  # add id to dictionary if not present yet
        id_counter[id] = 1
    color_values.append(id_counter[id] + 2 * id[1])
plot_polygons(tri_geoms, fill=True, cmap="viridis", colors=color_values, linewidth=2)
plt.show()
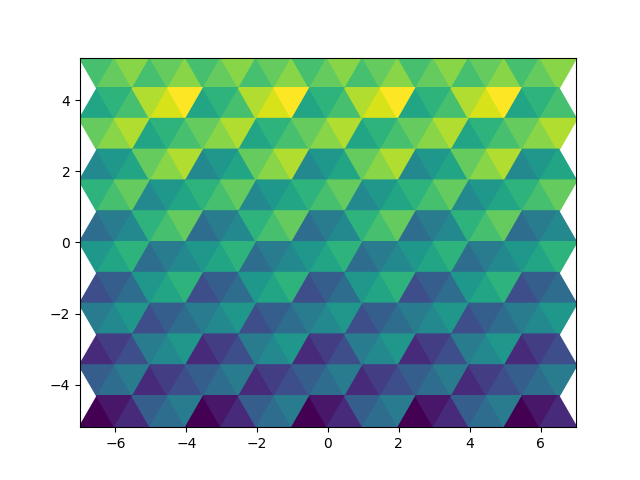
Ain’t that pretty?
This kind of trick can be used for resampling. Each cell is then divided into smaller cells. A nearest neighbour resampling is then used on the smaller cells, after which the mean or majority can be used to determine the value of the larger cell. Maybe I will implement that as a default method some day. It’s fun but also arguably a good way to go about resampling in many cases.
This is called remapping in the following publication:
Accadia, C., S. Mariani, M. Casaioli, A. Lavagnini, and A. Speranza, 2003: Sensitivity of Precipitation Forecast Skill Scores to Bilinear Interpolation and a Simple Nearest-Neighbor Average Method on High-Resolution Verification Grids. Wea. Forecasting, 18, 918–932, https://doi.org/10.1175/1520-0434(2003)018<0918:SOPFSS>2.0.CO;2 .
Total running time of the script: (0 minutes 0.484 seconds)