Note
Go to the end to download the full example code.
Hexagon grids
Adjusting shapes and sizes
Introduction
In this example a variety of hexagonal grids is created and compared. The goal of this exercise is to familiarize the reader with the various configurations of hexagonal grids and how they compare to one another.
Let’s create a grid and obtain the polygons in some area of interest.
from gridkit import HexGrid
from gridkit.doc_utils import plot_polygons

# create a grid
main_grid = HexGrid(size=10, shape="pointy")

target_loc = (0, 0)


def get_cells_around_target(grid):
    target_cell = grid.cell_at_point(target_loc)
    ids = grid.neighbours(target_cell, depth=3 * 10 / grid.size)
    shapes = grid.to_shapely(ids)
    return shapes


# define a location around which we want to obtain some cells

main_shapes = get_cells_around_target(main_grid)
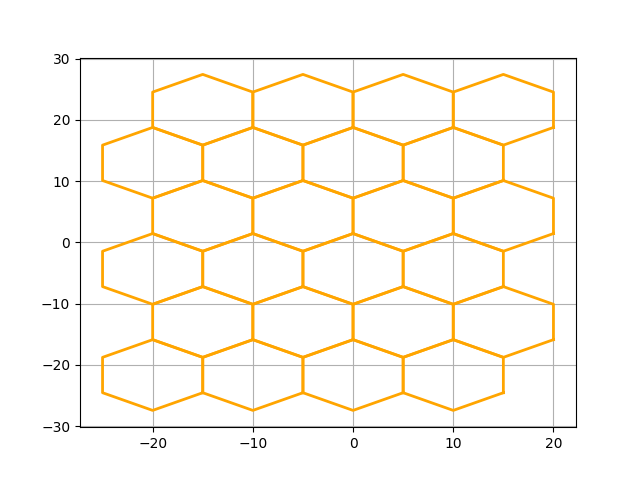
Now we have shapes representing some of the cells in the grid. Let’s plot the shapes to see what we are dealing with.
import matplotlib.pyplot as plt

plot_polygons(main_shapes, linewidth=2, fill=False, colors="orange")
plt.grid()
plt.show()

In this plot the gridlines are shown in the background to highlight how the grid is positioned in space We can modify this using the ‘offset’.
Shifting grids
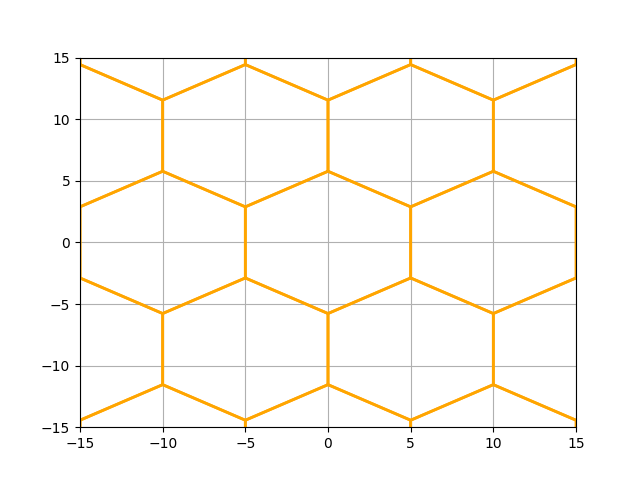
Let’s shift the whole grid vertically to center it around coordinate (0,0) Also, let’s zoom in a bit to the center
main_grid.offset = (0, main_grid.dy / 2)
main_shapes = get_cells_around_target(main_grid)

# plot the cell outlines
plot_polygons(main_shapes, linewidth=2, fill=False, colors="orange")
plt.xlim(-15, 15)
plt.ylim(-15, 15)
plt.grid()
plt.show()

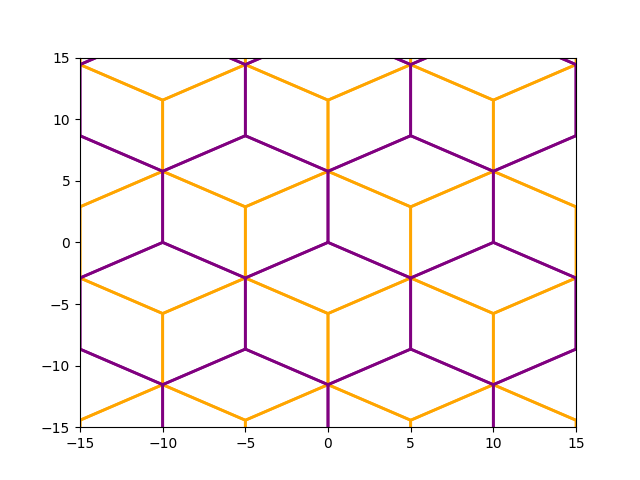
We can create a second grid and play with the size and offset If we shift the grid a deliberate amount so that it has a vertex on the center, it creates interesting patterns with respect to the grid we just created. For this we need to shift it half a ‘dx’ horizontally and half a radius (distance from center to corner) vertically, with respect to the main grid.
shifted_grid = main_grid.update(
    offset=(main_grid.dx / 2, (main_grid.dy + main_grid.r) / 2)
)
shifted_shapes = get_cells_around_target(
    shifted_grid,
)

# plot the cell outlines
plot_polygons(main_shapes, linewidth=2, fill=False, colors="orange")
plot_polygons(shifted_shapes, linewidth=2, fill=False, colors="purple")
plt.xlim(-15, 15)
plt.ylim(-15, 15)
plt.show()

Here we were able to use the dimensions of the already existing main_grid to determine the offset of the shifted grid. It is often more convenient to first create a grid and then shift it, than it is to calculate the desired shift beforehand. The advantage of determining the offset later is that we can use the already available dx, dy and r properties of the created grid. Even more convenient is that we can shift the grid after creating it using the .anchor() method. That way we don’t even have to get clever ourselves.
Grid sizes
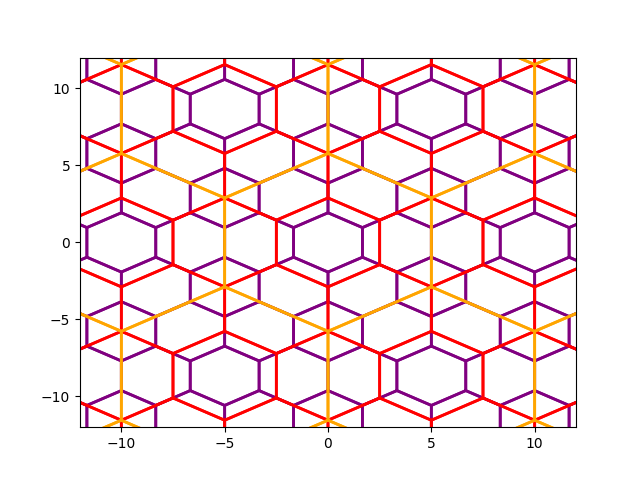
Finally, let’s play with the size of the grid. If we keep the grids centered around zero but vary the size, we also obtain interesting patterns.
half_size_grid = main_grid.update(size=main_grid.size / 2).anchor(target_loc)
third_size_grid = main_grid.update(size=main_grid.size / 3).anchor(target_loc)

half_size_shapes = get_cells_around_target(half_size_grid)
third_size_shapes = get_cells_around_target(third_size_grid)

# plot the cell outlines
plot_polygons(third_size_shapes, linewidth=2, fill=False, colors="purple")
plot_polygons(half_size_shapes, linewidth=2, fill=False, colors="red")
plot_polygons(main_shapes, linewidth=2, fill=False, colors="orange")

plt.xlim(-15, 15)
plt.ylim(-15, 15)
plt.show()

Grids that overlap and intersect in predictable ways can be utilized to select particular cells of interest. See Cell selection using other grids for a example where this is done.
Total running time of the script: (0 minutes 0.281 seconds)