Note
Go to the end to download the full example code
Tiled aggregation from points with Dask
Group points into grid cells in a tiled manner, using Dask.
Introduction
In example aggregate.py an approach is demonstrated where points are grouped in cells and averaged per cell. This example does the same, but in a tiled manner. Dask is used for the groupby opertaion instead of Pandas. The main difference is that Dask divides the data into chunks that can be processed independently. This approach is beneficial if data does not comfortably fit into memory. A second reason to use this approach is the ability to process different chunks concurrently, which can provide a significant speedup.
Note
Even though parallel processing using Dask can speed up the script, for a small case like this the overhead is larger than the benefit obtained by parallelizing the operation.
For a description of the approach used, please refer to aggregate.py. In this example only the differences between the approaches will be highlighted.
Note
Dask uses the terms ‘chunks’, ‘blocks’ and ‘partitions’. While there are some nuances, in this example these terms will be used interchangably. I will try to stick with ‘chunks’ where I can since this is the general term, though you will find references to ‘map_blocks()’ for Arrays and ‘map_partitions()’ for DataFrames.
Generate input data
Let’s start by generating some points.
The data will be a set of points scattered around a circle to create
a dougnut-like shape.
I will first generate the points and the turn them into a Dask Array
using dask.array.from_dask.
In a scenario where Dask is used because the data is large and memory is limited,
you will likely obtain your dask array in a way that
does not involve first loading the whole array into memory like I do here.
I will print npartitions to show the number of chunks the array is divided in
(spoiler, it will be 2000/500 = 4).
import dask
import dask.array
import dask.dataframe

from gridkit.doc_utils import generate_2d_scatter_doughnut, plot_polygons

points = generate_2d_scatter_doughnut(num_points=2000, radius=4)
points = dask.array.from_array(points, chunks=500)
print(points.npartitions)  # show the number of chunks ()
/tmp/gridkit_docs/v0.7.1/examples/vector_synergy/aggregate_dask.py:55: DeprecationWarning: The current Dask DataFrame implementation is deprecated.
In a future release, Dask DataFrame will use new implementation that
contains several improvements including a logical query planning.
The user-facing DataFrame API will remain unchanged.

The new implementation is already available and can be enabled by
installing the dask-expr library:

    $ pip install dask-expr

and turning the query planning option on:

    >>> import dask
    >>> dask.config.set({'dataframe.query-planning': True})
    >>> import dask.dataframe as dd

API documentation for the new implementation is available at
https://docs.dask.org/en/stable/dask-expr-api.html

Any feedback can be reported on the Dask issue tracker
https://github.com/dask/dask/issues

  import dask.dataframe
4
Relate points to grid cells
Now we can create a grid and determine the cell associated to each point. No advanced knowledge of Dask is required to follow this example. It suffices to know that ‘map_blocks’ and ‘map_partitions’ will apply the supplied function to all chunks.
from dask_geopandas.geohash import encode_geohash

from gridkit import HexGrid

grid = HexGrid(size=1, shape="flat")
cell_ids = points.map_blocks(lambda p: grid.cell_at_point(p).index, dtype=int)
In the example using Pandas, we were able to group by the GridIndex object. There we have one column that contains the grid index. Dask splits the x and y values of the index into two columns, so that approach won’t work here. We need a way to convert the x and y values of the index into a single number that can then be used in Dask’s groupby method. Fortunately, dask_geopandas already solved this prpblem by creating a spatial index function. Here I will use that function to create a geohash we can use to group.
df = dask.dataframe.from_array(cell_ids, columns=["x_id", "y_id"])
df["geohash"] = df.map_partitions(
    lambda df: encode_geohash(df.to_numpy(), as_string=False, precision=grid._size / 2)
)
# nr_points will contain the nr of points per cell once '.count()' is called on the groupy object
df["nr_points"] = 1
print(df)
Dask DataFrame Structure:
                x_id   y_id geohash nr_points
npartitions=4
0              int64  int64  uint64     int64
500              ...    ...     ...       ...
1000             ...    ...     ...       ...
1500             ...    ...     ...       ...
1999             ...    ...     ...       ...
Dask Name: assign, 8 graph layers
Notice how the DataFrame based on the cell_ids has separate columns for x and y values (which was the reason for creating the geohash in the first place). I will keep these values for they can be used after the groupby to reconstruct the grid indices.
grouped = df.groupby("geohash")
occurrences = grouped.count()
Now we have the number of points per cell.
In order to get the Polygon of each corresponding cell,
we were able to use the index in the pandas example to call grid.to_shapely.
Since now the index is based on the geohash, the grid index first needs to be obtained in a different way.
I will use the x and y columns for that that were created when the cell_ids were converted to the Dask DataFrame.
Since all values of x and y should be the same for a given geohash, we can take the ‘first’ x and y values per geohash.
dask.compute is called to read out the results into a pandas dataframe.
Note
If you are wondering why we went through all that effort just to end up with a pandas DataFrame in the end, suffice it to say that the size of the data is significantly reduced after the groupby. Also, for the sake of the example I will plot the data with matplotlib. If this was indeed on your mind, nice, stay sharp ;)
index = grouped.first()[["x_id", "y_id"]]
polygons = index.map_partitions(grid.to_shapely, meta={"geoms": object})
geoms, points_per_cell = dask.compute(polygons, occurrences.nr_points)
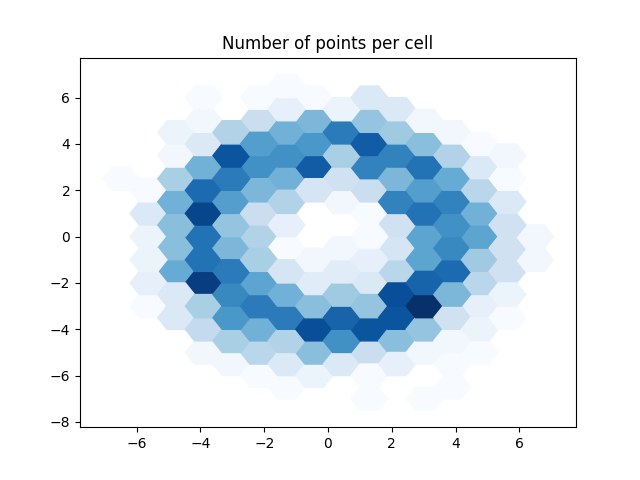
Visualize the results
Note how the results are identical to the pandas version. The input data was the same so this should indeed be the case.
import matplotlib.pyplot as plt

plot_polygons(geoms, points_per_cell, "Blues")
plt.title("Number of points per cell")
plt.show()
Total running time of the script: (0 minutes 0.803 seconds)