Note
Go to the end to download the full example code
Aggregate from points
Group points into grid cells
Note
For a tiled implementation of this approach using Dask, see example aggregate_dask.py
TL;DR
1import pandas
2from gridkit import HexGrid
3
4grid = HexGrid(size=1, shape="flat")
5cell_ids = grid.cell_at_point(points)
6df = pandas.DataFrame({"nr_points": 0, "grid_id": list(cell_ids)})
7occurrences = df.groupby("grid_id").count()
Introduction
Grouping points in cells (here referred to as ‘aggregation’) is a common occurrence in spatial data processing. This is often used to generate heatmaps, obtain statistics of the data or to reduce the size of the data for easier processing. By grouping nearby points in the same cell, you can for example calculate the standard deviation to get a feel for the variability of your data.
In this example we will count the number of points in a cell. This gives a sense of the distribution of the points. Other common operations for this kind of exercise are: std, mean, median, percentile, min and max.
Tip
Groupby operations can also be done on polygons of arbitrary shape. If this is of interest to you, have a look at GeoPanda’s sjoin
Generate input data
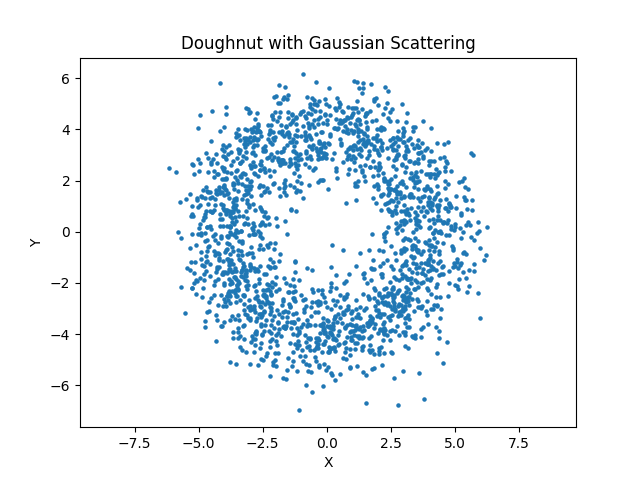
Let’s start by generating some points. The data will be a set of points scattered around a circle to create a dougnut-like shape. I’ll plot the input here to show what it looks like.
import matplotlib.pyplot as plt

from gridkit.doc_utils import generate_2d_scatter_doughnut, plot_polygons

points = generate_2d_scatter_doughnut(num_points=2000, radius=4)

# Create the scatter plot
plt.scatter(*points.T, s=5)
plt.xlabel("X")
plt.ylabel("Y")
plt.title("Doughnut with Gaussian Scattering")
plt.axis("equal")
plt.show()
Relate points to grid cells
Now we can create a grid and aggregate our points onto that grid.
from gridkit import HexGrid

grid = HexGrid(size=1, shape="flat")
cell_ids = grid.cell_at_point(points)
Count the points per cell
The cell_ids obtained in the previous step can be used to group the points.
Each point with the same ‘cell_id’ will be regarded as being in the same ‘bin’.
We can then do statistics on these bins. In our case we will count the number of points per bin.
For convenience, I will use a panda’s groupby functionality for this.
import pandas

df = pandas.DataFrame(
    {"nr_points": 0, "cell_id": list(cell_ids)}
)  # The 'nr_points' will contain the result after `.count()` is called
occurrences = df.groupby("cell_id").count()
/tmp/gridkit_docs/v0.7.1/examples/vector_synergy/aggregate.py:101: DeprecationWarning:
Pyarrow will become a required dependency of pandas in the next major release of pandas (pandas 3.0),
(to allow more performant data types, such as the Arrow string type, and better interoperability with other libraries)
but was not found to be installed on your system.
If this would cause problems for you,
please provide us feedback at https://github.com/pandas-dev/pandas/issues/54466

  import pandas
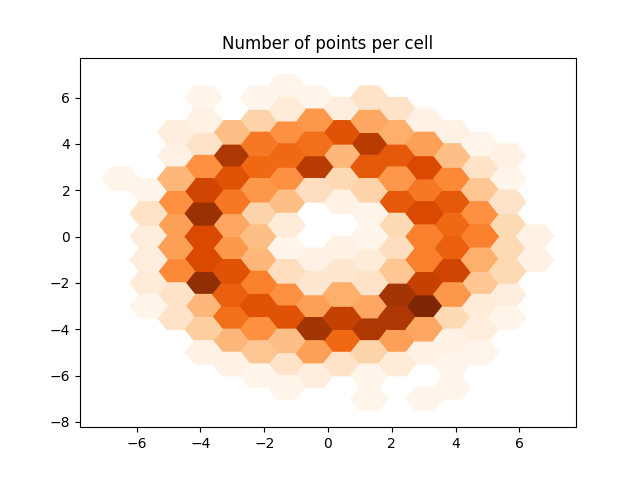
Visualize the results
Now we have the number of points per cell, let’s obtain the corresponding cell shapes from the grid object and plot them.
geoms = grid.to_shapely(occurrences.index.to_list())
plot_polygons(geoms, colors=occurrences["nr_points"].values, cmap="Oranges")
plt.title("Number of points per cell")
plt.show()
Total running time of the script: (0 minutes 0.541 seconds)