Note
Go to the end to download the full example code.
Interpolate from points
Fill a BoundedGrid based on point data
Introduction
In this example a DataTile is created from a set of points by interpolating between the points.
For this operation we need:
locations of the points
values of the points
a grid to interpolate on
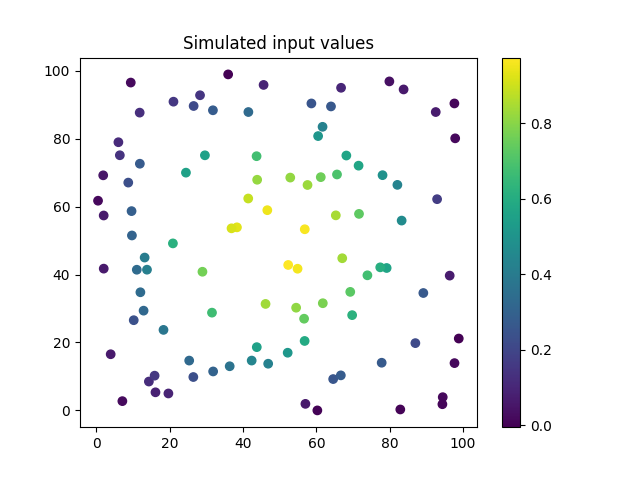
In this example, we simulate the point data using a 2D sinusoidal equation. We sample the equation at pseudo-random locations.
import numpy

numpy.random.seed(0)
x = 100 * numpy.random.rand(100)
numpy.random.seed(1)
y = 100 * numpy.random.rand(100)
values = numpy.sin(x / (10 * numpy.pi)) * numpy.sin(y / (10 * numpy.pi))
points = numpy.array([x, y]).T
This input data looks as follows:
import matplotlib.pyplot as plt

plt.scatter(x, y, c=values)
plt.colorbar()
plt.title("Simulated input values")
plt.show()
Now we can create a grid with your desired specifications and interpolate onto that grid.
from gridkit import DataTile, HexGrid

empty_grid = HexGrid(size=6, shape="pointy", offset=(2, 0))
data_tile = DataTile.from_interpolated_points(empty_grid, points, values)

import shapely.geometry
Currently the interpolation methods “nearest”, “linear” and “cubic” are supported,
based on scpiy’s NearestNDInterpolator, LinearNDInterpolator and CloughTocher2DInterpolator, respectively.
Here we try each method and plot them next to each other to compare.
from gridkit.doc_utils import plot_polygons

fig, axes = plt.subplots(1, 3, sharey=True, figsize=(12, 5))

for ax, method in zip(axes, ("nearest", "linear", "cubic")):
    data_tile = DataTile.from_interpolated_points(
        empty_grid,
        points,
        values,
        method=method,
    )

    # plot the interpolated values at the cells
    plot_polygons(
        data_tile.to_shapely(), data_tile.to_numpy().ravel(), "viridis", ax=ax
    )

    # plot original data
    ax.scatter(x, y, c=values, edgecolors="black")

    # add outline of the grid bounds
    plot_polygons(
        shapely.geometry.Polygon(data_tile.corners()),
        colors="red",
        fill=False,
        linewidth=1,
        ax=ax,
        set_zoom_to_bounds=False,
    )

    ax.set_title(method, fontdict={"fontsize": 30})

fig.tight_layout()
plt.show()
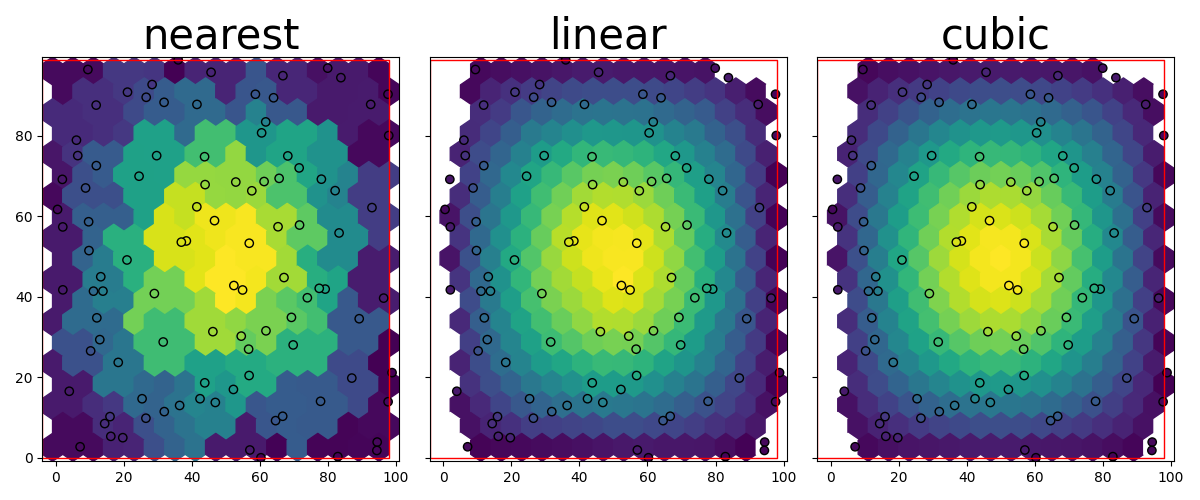
In this example, the cubic interpolation represents the original function the best, but this will differ per usecase.
Note how the DataTile has nodata values at the border in the “linear” and “cubic” cases.
The bounds of the grid are automatically chosen include all points.
Cells of which the center is not within the convex hull of the data,
but are within the selected tile, get a nodata_value as specified when calling DataTile.from_interpolated_points() (default numpy.nan or dtype equivalent).
Total running time of the script: (0 minutes 0.492 seconds)