Note
Go to the end to download the full example code.
Partial overlap
Merge rasters with different spatial extent
Introduction
Since each Tile in GridKit has information on it’s spatial positioning, multiple grids can be combined in a way where their spatial extend is taken into account. Basic mathematical operations were shown in the example ndvi.py, but in that example the different bands were perfectly overlapping in space. In this example we are combining grids that are partially overlapping. To combine the grids we will be taking the mean value for the cells that are shared between the grids.
In order to keep the scope of this test limited, three slices of tha same geotiff are used. In most real cases, it is likely that these would be separate datasets that don’t perfectly match. Note that in these cases, all datasets need to be resampled onto the same grid. Also, since all slices in this example are from the same dataset, the values in the overlapping sections will be identical, making for seamless fusing of the grids. If the values in the overlapping area differ a lot between the datasets, the seams won’t be as smooth. We will simulate what that might look like further down in this example.
That said, let’s read in the data. The source of the DEM data used in this example is: https://www.eea.europa.eu/data-and-maps/data/copernicus-land-monitoring-service-eu-dem
from gridkit import raster_to_data_tile

path_dem = "../../tests/data/alps_dem.tiff"

dem1 = raster_to_data_tile(path_dem, bounds=(29040, 167500, 29100, 167620))
dem2 = raster_to_data_tile(path_dem, bounds=(29070, 167470, 29150, 167580))
dem3 = raster_to_data_tile(path_dem, bounds=(29080, 167520, 29160, 167600))
/tmp/gridkit_docs/v1.0.0/gridkit-py/gridkit/io.py:301: UserWarning: The data type '0.0' cannot be safely converted into 'int16' for file ../../tests/data/alps_dem.tiff. Falling back to unsafe cast. Consider fixing the nodata value in the metadata of the file.
  warnings.warn(
Let’s group them for convenience
dem_slices = [dem1, dem2, dem3]
And then plot these data slices individually to see what we are dealing with
import matplotlib.pyplot as plt

fig, axes = plt.subplots(1, 3)
for ax, dem in zip(axes, dem_slices):
    ax.imshow(dem, cmap="terrain", extent=dem.mpl_extent)

fig.tight_layout()
plt.show()
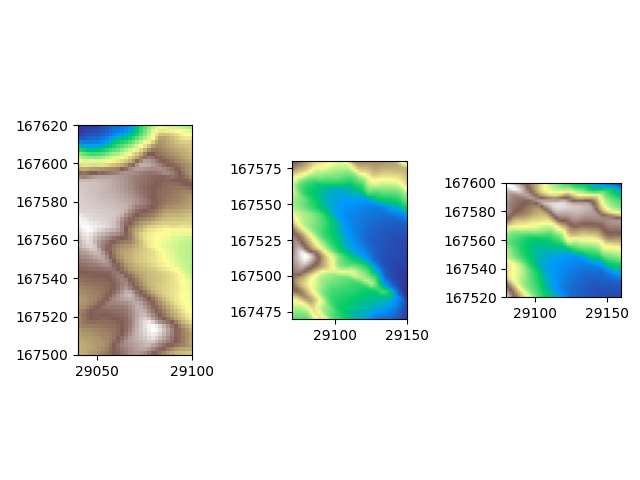
It is hard to see from these three separate images which parts of the slices overlap.
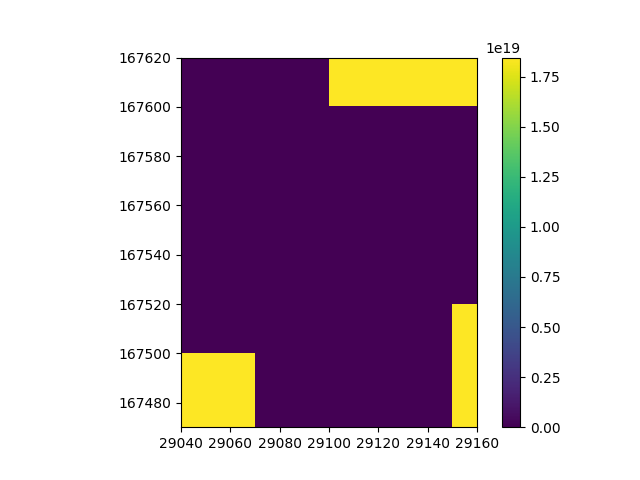
If we visualize the count per cell, we can get a better idea on the distribution of the data.
import gridkit

dem_count = gridkit.count(dem_slices)

plt.imshow(dem_count, extent=dem_count.mpl_extent)
plt.colorbar()
plt.show()
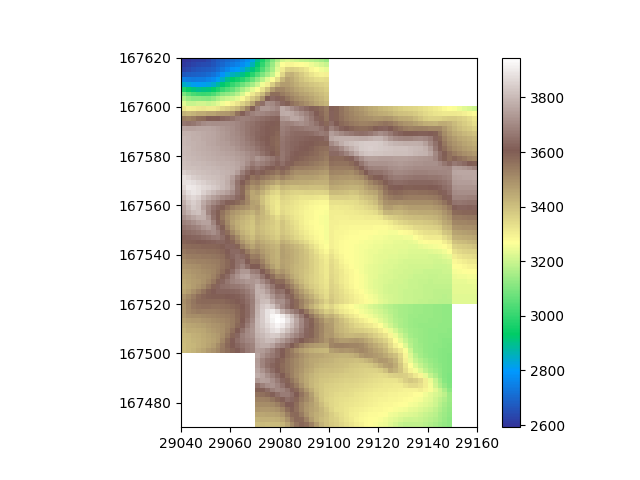
Now we have an idea on what the spatial distribution of the data looks like, let’s take the mean of the datasets to combine them into one. For each cell, this will take the mean value of all tiles that cover it.
dem_mean = gridkit.mean(dem_slices)

plt.imshow(dem_mean, cmap="terrain", extent=dem_mean.mpl_extent)
plt.colorbar()
plt.show()

Beautiful, The data is merged!
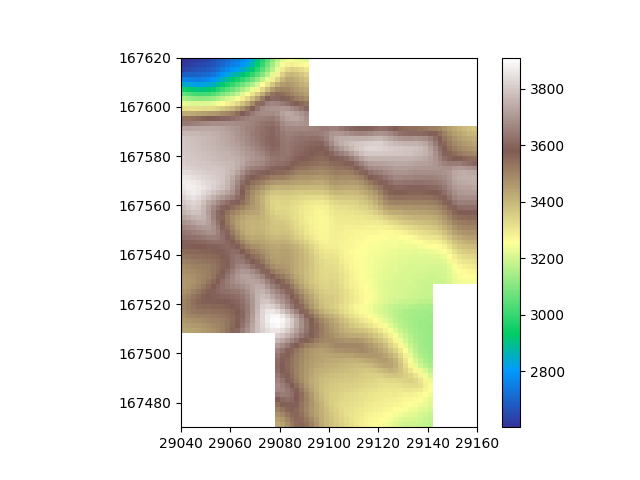
In this case of course all values of the slices are the same, so the seams are perfectly smooth. We can see the seems if we offset the values of the different slices a bit.
dem_mean = gridkit.mean([dem1 - 100, dem2, dem3 + 100])

plt.imshow(dem_mean, cmap="terrain", extent=dem_mean.mpl_extent)
plt.colorbar()
plt.show()
Now the seams become visible. If this is a problem for your dataset, consider cleaning the data before merging or smoothing the data after merging.
For smoothing the data afterwards, we can use scipy’s gaussian_filter. Note that scipy treats our DataTile object as a numpy array, so we need to update the existing DataTile with the array returned from the scipy function. A larger convolution window (sigma) will result in more aggressive filtering. This will result in smoother seams between slices, but also remove high-frequency signal from your data. When merging tiles therefore, a tradeoff will need to be reached that will differ per usecase.
from scipy.ndimage import gaussian_filter

filtered_data = gaussian_filter(dem_mean, sigma=1)
dem_filtered = dem_mean.update(filtered_data)

plt.imshow(dem_filtered, cmap="terrain", extent=dem_mean.mpl_extent)
plt.colorbar()
plt.show()
Tip
You may have noticed that area’s containing NaNs get exaggerated after filtering.
Scipy’s implementation of gaussian_filter does not take NaNs into account.
This means each pixel where the kernal contains a NaN will become NaN too.
If this is a problem for your dataset,
have a look at astropy’s implementation.
Nodata values
For each data tile, the nodata value of that data tile is also taken into account. This means that values outside of the original extent of each respective data tile are not considered in the calculation. If the data grids have different nodata_values, this still works, because each tile’s nodata_value is considered separately. In that scenario the averaged data tile will have the nodata_value set to that of the first grid.
Total running time of the script: (0 minutes 0.611 seconds)