Note
Go to the end to download the full example code
Rotating grids
Rotation of grids
Introduction
Grids can be rotated around the origin. This means they don’t have to align with the axes of the chosen coordinate refrence system, but can be skewed. This example shows what that looks like. Let’s first create a simple grid. The rotation can be set when creating a new grid.
from gridkit import TriGrid
from gridkit.doc_utils import plot_polygons
from matplotlib import pyplot as plt
import numpy

grid = TriGrid(size=1, rotation=20)

ids_x = ids_y = numpy.arange(10)
xx, yy = numpy.meshgrid(ids_x, ids_y)
ids = numpy.stack([xx.ravel(), yy.ravel()]).T

centroids = grid.centroid(ids)
geometries = grid.to_shapely(ids, as_multipolygon=True)

# Plot centroids
plt.scatter(*centroids.T, marker="x")
plot_polygons(geometries.geoms, colors="black", fill=False, linewidth=2)
plt.show()
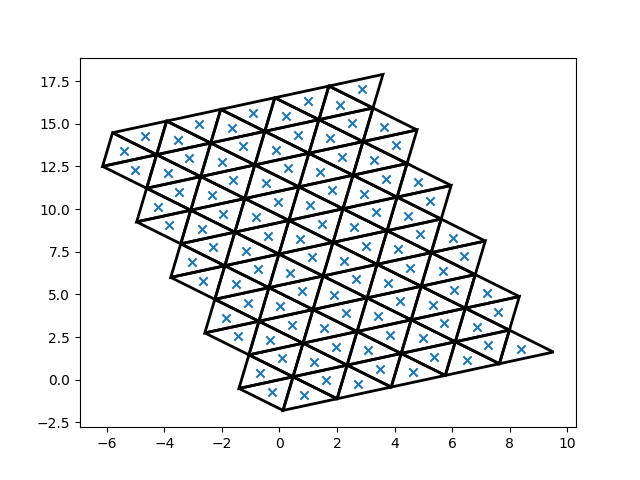
Note how the grid was rotated counter-clockwise by 20 degrees. If you want to rotate clockwise by 20 degrees instead, supply a negetive rotation of -20.
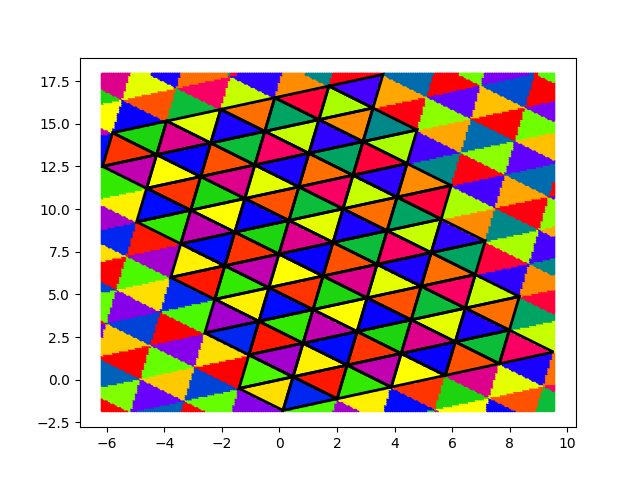
Let’s test ‘cell_at_point’ with the rotated grid We can create a bunch of points in and around the area we selected and color them based on their id.
b = geometries.bounds
px = numpy.linspace(b[0], b[2], 200)
py = numpy.linspace(b[1], b[3], 200)
xx, yy = numpy.meshgrid(px, py)
points = numpy.stack([xx.ravel(), yy.ravel()]).T
point_ids = grid.cell_at_point(points)
colors = point_ids.index[:,0] * 2+point_ids.index[:,1]

# Plot points in cell
plt.scatter(*points.T, s=3, c=colors, cmap="prism")
plot_polygons(geometries.geoms, colors="black", fill=False, linewidth=2)
plt.show()
Naturally, when the grid is rotated 90 degrees the horizontal lines turn to vertical lines, but this can also be achived by rotating 30 degrees. This is of course a feature of trigangular grids. For comparisson, let’s show a grid for the rotations of 0, 30, 60 and 90 degrees.
ids_x = ids_y = numpy.arange(7)
xx, yy = numpy.meshgrid(ids_x, ids_y)
ids = numpy.stack([xx.ravel(), yy.ravel()]).T
def plot_rotated_grid(rotation, ax):
    grid = TriGrid(size=1, rotation=rotation)
    geometries = grid.to_shapely(ids, as_multipolygon=True)
    plot_polygons(geometries.geoms, colors="black", fill=False, linewidth=2, ax=ax)

fig, axes = plt.subplots(2,2)
for rotation, ax in zip([0, 30, 60, 90], axes.ravel()):
    plot_rotated_grid(rotation, ax)
plt.show()
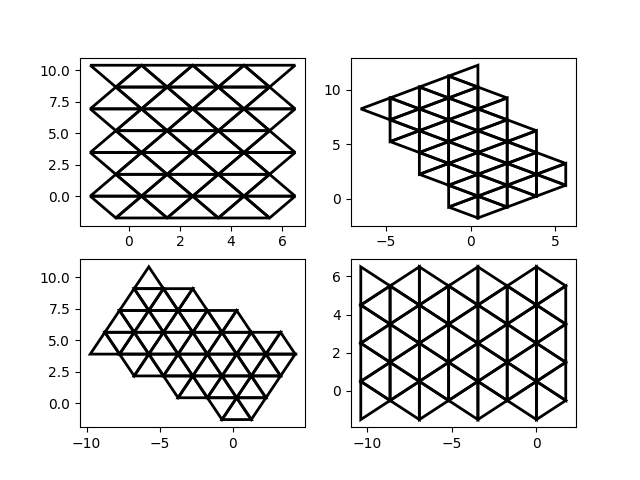
A careful observer might notice that the x and y axes show different values for different rotation. The same ids are used for all rotations, but since the grid is rotated the ids are at different locations. This means ids from a grid with a different rotation are not compatible.
Warning
The operations cells_in_bounds or rotated grids, as well as rotated BoudedGrids are not supported.
The bounds for these operations represent a rectangle that is aligned with the coordinate reference system.
It is not obvioush how this should relate to a rotated grid,
as the cells and the bounds will not align and thus the cells will be cut by the bounds.
If this is to be supported, a clear definition will have to be created about what it means
for a rotated grid to be aligned with ‘straight’ bounds.
Total running time of the script: (0 minutes 0.830 seconds)